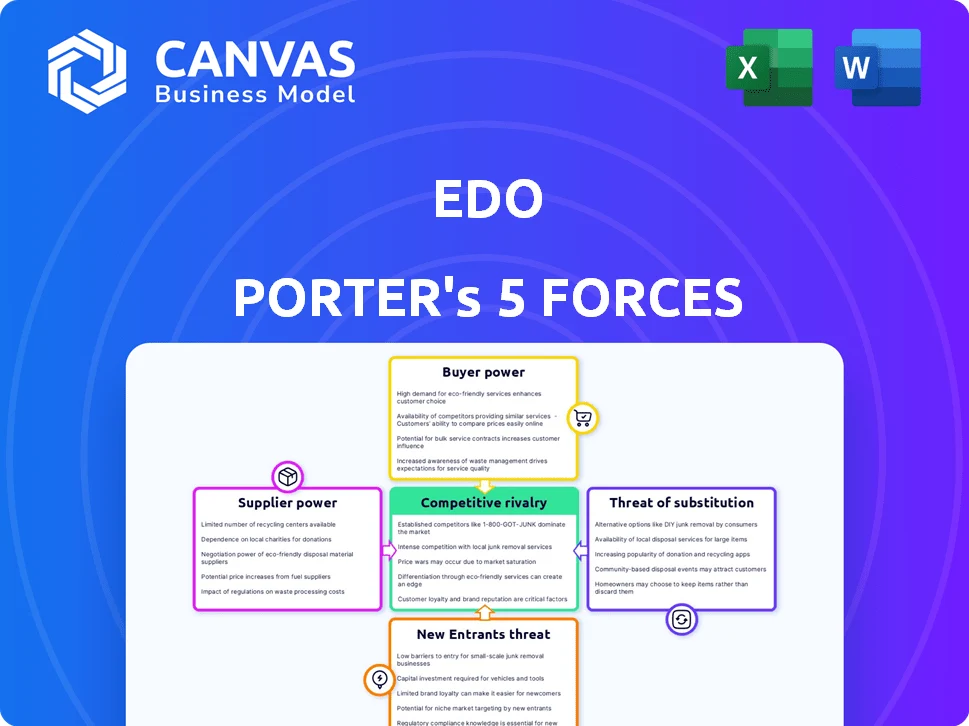
EDO PORTER'S FIVE FORCES TEMPLATE RESEARCH
What is included in the product
 Detailed Word Document
Analyzes the competitive forces influencing EDO's profitability and market position, highlighting key challenges.

 Customizable Excel Spreadsheet
Identify vulnerabilities in minutes. Easily grasp industry power dynamics.
What You See Is What You Get
EDO Porter's Five Forces Analysis
This preview is the actual EDO Porter's Five Forces Analysis you'll receive. It's a fully developed document, not a sample or draft.

Porter's Five Forces Analysis Template

Go Beyond the Preview—Access the Full Strategic Report
EDO's competitive landscape is shaped by five key forces: supplier power, buyer power, threat of new entrants, threat of substitutes, and competitive rivalry. Understanding these forces is crucial for strategic positioning. Analyzing each force reveals potential vulnerabilities and opportunities for growth. A proper assessment informs better investment decisions and risk management. This snapshot offers a glimpse into EDO's market dynamics. Ready to move beyond the basics? Get a full strategic breakdown of EDO’s market position, competitive intensity, and external threats—all in one powerful analysis.
Suppliers Bargaining Power

Data Providers
EDO's reliance on data providers, such as those offering TV viewership or online behavior data, significantly shapes its operational landscape. The bargaining power of these suppliers hinges on data exclusivity; a sole-source provider of critical insights holds considerable leverage. As of 2024, the market for such data is competitive, impacting pricing. For example, premium data sets can cost hundreds of thousands of dollars annually.
Technology Providers
EDO's reliance on advanced analytics and machine learning algorithms means its bargaining power with technology suppliers is crucial. If EDO depends on specific, unique software, the suppliers could have leverage. For instance, in 2024, companies spent $1.6 trillion on IT services globally, highlighting the potential impact of supplier power.

Talent Pool
EDO, as a data analytics firm, heavily relies on skilled professionals. The demand for data scientists and engineers is high, influencing labor costs. In 2024, the average data scientist salary in the U.S. was around $130,000, reflecting supplier power.

Infrastructure Providers
EDO's operations, like many modern businesses, hinge on cloud computing and IT infrastructure. The bargaining power of these suppliers depends on market competition and EDO's vendor reliance. In 2024, the cloud computing market is dominated by a few major players. This concentration gives these providers significant leverage.
- The global cloud computing market size was valued at USD 677.26 billion in 2024.
- Amazon Web Services (AWS) held around 32% of the market share in 2024.
- Microsoft Azure followed with approximately 23% of the market share.
- Google Cloud Platform (GCP) had roughly 11% of the market share in 2024.
Consulting and Specialized Services
EDO's reliance on external consultants, such as those in IT or legal, significantly impacts its operational costs and project outcomes. The bargaining power of these suppliers is high when specialized expertise is scarce. For instance, in 2024, the average hourly rate for specialized IT consultants reached $175, reflecting their strong market position.
- Specialized expertise commands higher prices, as seen with IT consultants' rates in 2024.
- The availability of alternative providers directly influences EDO's negotiation leverage.
- High switching costs, such as project data migration, fortify supplier power.
- Consultants with proprietary tools or unique methodologies hold more sway.
EDO's Supplier Power: Data, Tech, and Consulting Costs
EDO's supplier power is influenced by data exclusivity and vendor concentration. The cloud computing market, valued at $677.26 billion in 2024, gives major players like AWS (32% market share) and Microsoft Azure (23%) leverage. Specialized IT consultants' hourly rates reached $175 in 2024.
| Supplier Type | Market Dynamics | Impact on EDO |
|---|---|---|
| Data Providers | Competitive, with premium data sets costing hundreds of thousands annually. | Influences operational costs and access to critical insights. |
| Technology Suppliers | High demand for advanced analytics and machine learning. | Affects costs related to software, hardware, and IT infrastructure. |
| Consultants | Specialized skills in high demand. | Impacts operational costs and project success. |
Customers Bargaining Power

Concentration of Customers
EDO's primary clients consist of media firms, advertisers, and marketing agencies. Suppose a few major clients account for a substantial part of EDO's income. These clients might wield considerable bargaining power, possibly negotiating reduced prices or tailored services. For example, if 3 major clients make up 60% of EDO's revenue, their influence increases. In 2024, the top 5 clients in the advertising sector accounted for approximately 55% of total spending.
Switching Costs
Switching costs significantly affect customer bargaining power within EDO's platform. When switching costs are low, customers can readily choose competitors, strengthening their position. In 2024, the average customer churn rate across SaaS platforms, a sector EDO somewhat resembles, was around 5-7% annually. This indicates moderate customer mobility, influencing EDO's pricing strategy.

Customer Information and Expertise
Clients with robust data analytics can negotiate better terms with EDO, as they need EDO less. In 2024, companies investing heavily in internal analytics saw a 15% increase in negotiation leverage. Those reliant on EDO's insights have weaker bargaining power. This dynamic is evident in the financial services sector, where data capabilities vary widely.

Price Sensitivity
Customers' price sensitivity significantly impacts their bargaining power in the EDO market. If EDO's services are viewed as similar to competitors', customers become more price-conscious. The ability to switch to cheaper alternatives gives them strong bargaining power. For example, in 2024, the average price difference between similar services was around 10-15%, significantly affecting customer choice.
- Switching Costs: Low switching costs increase customer bargaining power.
- Market Competition: High competition leads to greater price sensitivity.
- Information Availability: Transparent pricing empowers customers.
- Service Differentiation: Unique services reduce price sensitivity.
Potential for Backward Integration
Large clients possess the option to create their own advertising effectiveness tools, which boosts their bargaining power. This backward integration strategy allows them to bypass external providers, potentially lowering costs and increasing control. For instance, major corporations such as Procter & Gamble have invested heavily in proprietary analytics platforms. This shift can intensify competition among existing suppliers.
- Procter & Gamble's advertising spending in 2023 was approximately $7.8 billion, reflecting their significant investment in marketing.
- The global advertising market was valued at around $715.7 billion in 2023.
- Companies with strong in-house capabilities can reduce reliance on external vendors.
- Backward integration can lead to improved data insights and strategic advantages.
Customer Power in EDO: Key Factors
Customer bargaining power in EDO is influenced by market dynamics. Low switching costs and high competition amplify customer influence. In 2024, the advertising sector saw significant price sensitivity.
Clients with strong internal analytics can negotiate better terms. Large clients may opt for backward integration, increasing their leverage. The overall market size and competitive intensity also affect customer power.
The ability of customers to switch, access information, and the degree of service differentiation further shape their bargaining power. This dynamic impacts pricing and service terms. The global advertising market reached $715.7 billion in 2023.
| Factor | Impact | 2024 Data/Examples |
|---|---|---|
| Switching Costs | Low costs increase power | SaaS churn rates: 5-7% |
| Market Competition | High competition boosts power | Avg. price diff: 10-15% |
| Client Size | Large clients have more power | P&G ad spend: $7.8B (2023) |
Rivalry Among Competitors

Number and Diversity of Competitors
EDO competes in the advertising effectiveness measurement market, a space with many rivals providing campaign analytics. The diversity of these competitors, from established firms to startups, intensifies the competition. For example, the advertising analytics market was valued at $8.6 billion in 2024, with a projected CAGR of 12.8% from 2024 to 2032.
Industry Growth Rate
The advertising technology and analytics market is highly competitive. Slower growth, like the projected 11.5% in 2024, sharpens rivalry. Companies intensely pursue market share. This intensifies price wars and innovation pressures.

Brand Identity and Differentiation
EDO's real-time focus faces competition as rivals differentiate. Brand identity and unique offerings affect rivalry intensity. In 2024, the ad tech market saw $400B+ in global ad spend. Differentiation is key in this competitive landscape.

Exit Barriers
High exit barriers, such as specialized assets or long-term contracts, can trap companies in a competitive market, even when profits are low. This intensifies rivalry as firms fight for market share to cover fixed costs. For example, the airline industry, with its high capital investments in aircraft, often sees fierce competition. In 2024, the airline industry's net profit margin was approximately 3.4%, reflecting intense competition.
- High exit barriers increase rivalry.
- Specialized assets and long-term contracts are examples.
- Airlines are a good example of this.
- In 2024, airline profit margins were low.
Strategic Stakes
The strategic stakes in the advertising effectiveness market significantly impact competitive rivalry. Parent companies of EDO's rivals, like Kantar and Nielsen, may heavily invest in this area. These investments can lead to aggressive strategies, such as price wars or increased marketing efforts, to gain market share. This heightened competition directly affects EDO's market position and profitability.
- Kantar reported revenues of $2.9 billion in 2023, indicating substantial resources to invest in competitive strategies.
- Nielsen's revenue was approximately $6.5 billion in 2023, showcasing its ability to sustain competitive pressures.
- The advertising effectiveness market is projected to reach $28 billion by 2028, increasing the stakes for all players.
Ad Effectiveness Market: Billions at Stake!
Competitive rivalry in the ad effectiveness market is fierce, with many players and high stakes. High exit barriers intensify competition, keeping firms engaged even with low profits. EDO faces rivals backed by significant resources, leading to aggressive market strategies.
| Aspect | Details |
|---|---|
| Market Value (2024) | $8.6 billion |
| CAGR (2024-2032) | 12.8% |
| Ad Tech Market Spend (2024) | $400B+ |
Original: $10.00
-65%$10.00
$3.50Product Information
Product Information
Shipping & Returns
Shipping & Returns
Description
What is included in the product
Detailed Word Document
Analyzes the competitive forces influencing EDO's profitability and market position, highlighting key challenges.
Customizable Excel Spreadsheet
Identify vulnerabilities in minutes. Easily grasp industry power dynamics.
What You See Is What You Get
EDO Porter's Five Forces Analysis
This preview is the actual EDO Porter's Five Forces Analysis you'll receive. It's a fully developed document, not a sample or draft.
Porter's Five Forces Analysis Template
Go Beyond the Preview—Access the Full Strategic Report
EDO's competitive landscape is shaped by five key forces: supplier power, buyer power, threat of new entrants, threat of substitutes, and competitive rivalry. Understanding these forces is crucial for strategic positioning. Analyzing each force reveals potential vulnerabilities and opportunities for growth. A proper assessment informs better investment decisions and risk management. This snapshot offers a glimpse into EDO's market dynamics. Ready to move beyond the basics? Get a full strategic breakdown of EDO’s market position, competitive intensity, and external threats—all in one powerful analysis.
Suppliers Bargaining Power
Data Providers
EDO's reliance on data providers, such as those offering TV viewership or online behavior data, significantly shapes its operational landscape. The bargaining power of these suppliers hinges on data exclusivity; a sole-source provider of critical insights holds considerable leverage. As of 2024, the market for such data is competitive, impacting pricing. For example, premium data sets can cost hundreds of thousands of dollars annually.
Technology Providers
EDO's reliance on advanced analytics and machine learning algorithms means its bargaining power with technology suppliers is crucial. If EDO depends on specific, unique software, the suppliers could have leverage. For instance, in 2024, companies spent $1.6 trillion on IT services globally, highlighting the potential impact of supplier power.
Talent Pool
EDO, as a data analytics firm, heavily relies on skilled professionals. The demand for data scientists and engineers is high, influencing labor costs. In 2024, the average data scientist salary in the U.S. was around $130,000, reflecting supplier power.
Infrastructure Providers
EDO's operations, like many modern businesses, hinge on cloud computing and IT infrastructure. The bargaining power of these suppliers depends on market competition and EDO's vendor reliance. In 2024, the cloud computing market is dominated by a few major players. This concentration gives these providers significant leverage.
- The global cloud computing market size was valued at USD 677.26 billion in 2024.
- Amazon Web Services (AWS) held around 32% of the market share in 2024.
- Microsoft Azure followed with approximately 23% of the market share.
- Google Cloud Platform (GCP) had roughly 11% of the market share in 2024.
Consulting and Specialized Services
EDO's reliance on external consultants, such as those in IT or legal, significantly impacts its operational costs and project outcomes. The bargaining power of these suppliers is high when specialized expertise is scarce. For instance, in 2024, the average hourly rate for specialized IT consultants reached $175, reflecting their strong market position.
- Specialized expertise commands higher prices, as seen with IT consultants' rates in 2024.
- The availability of alternative providers directly influences EDO's negotiation leverage.
- High switching costs, such as project data migration, fortify supplier power.
- Consultants with proprietary tools or unique methodologies hold more sway.
EDO's Supplier Power: Data, Tech, and Consulting Costs
EDO's supplier power is influenced by data exclusivity and vendor concentration. The cloud computing market, valued at $677.26 billion in 2024, gives major players like AWS (32% market share) and Microsoft Azure (23%) leverage. Specialized IT consultants' hourly rates reached $175 in 2024.
| Supplier Type | Market Dynamics | Impact on EDO |
|---|---|---|
| Data Providers | Competitive, with premium data sets costing hundreds of thousands annually. | Influences operational costs and access to critical insights. |
| Technology Suppliers | High demand for advanced analytics and machine learning. | Affects costs related to software, hardware, and IT infrastructure. |
| Consultants | Specialized skills in high demand. | Impacts operational costs and project success. |
Customers Bargaining Power
Concentration of Customers
EDO's primary clients consist of media firms, advertisers, and marketing agencies. Suppose a few major clients account for a substantial part of EDO's income. These clients might wield considerable bargaining power, possibly negotiating reduced prices or tailored services. For example, if 3 major clients make up 60% of EDO's revenue, their influence increases. In 2024, the top 5 clients in the advertising sector accounted for approximately 55% of total spending.
Switching Costs
Switching costs significantly affect customer bargaining power within EDO's platform. When switching costs are low, customers can readily choose competitors, strengthening their position. In 2024, the average customer churn rate across SaaS platforms, a sector EDO somewhat resembles, was around 5-7% annually. This indicates moderate customer mobility, influencing EDO's pricing strategy.
Customer Information and Expertise
Clients with robust data analytics can negotiate better terms with EDO, as they need EDO less. In 2024, companies investing heavily in internal analytics saw a 15% increase in negotiation leverage. Those reliant on EDO's insights have weaker bargaining power. This dynamic is evident in the financial services sector, where data capabilities vary widely.
Price Sensitivity
Customers' price sensitivity significantly impacts their bargaining power in the EDO market. If EDO's services are viewed as similar to competitors', customers become more price-conscious. The ability to switch to cheaper alternatives gives them strong bargaining power. For example, in 2024, the average price difference between similar services was around 10-15%, significantly affecting customer choice.
- Switching Costs: Low switching costs increase customer bargaining power.
- Market Competition: High competition leads to greater price sensitivity.
- Information Availability: Transparent pricing empowers customers.
- Service Differentiation: Unique services reduce price sensitivity.
Potential for Backward Integration
Large clients possess the option to create their own advertising effectiveness tools, which boosts their bargaining power. This backward integration strategy allows them to bypass external providers, potentially lowering costs and increasing control. For instance, major corporations such as Procter & Gamble have invested heavily in proprietary analytics platforms. This shift can intensify competition among existing suppliers.
- Procter & Gamble's advertising spending in 2023 was approximately $7.8 billion, reflecting their significant investment in marketing.
- The global advertising market was valued at around $715.7 billion in 2023.
- Companies with strong in-house capabilities can reduce reliance on external vendors.
- Backward integration can lead to improved data insights and strategic advantages.
Customer Power in EDO: Key Factors
Customer bargaining power in EDO is influenced by market dynamics. Low switching costs and high competition amplify customer influence. In 2024, the advertising sector saw significant price sensitivity.
Clients with strong internal analytics can negotiate better terms. Large clients may opt for backward integration, increasing their leverage. The overall market size and competitive intensity also affect customer power.
The ability of customers to switch, access information, and the degree of service differentiation further shape their bargaining power. This dynamic impacts pricing and service terms. The global advertising market reached $715.7 billion in 2023.
| Factor | Impact | 2024 Data/Examples |
|---|---|---|
| Switching Costs | Low costs increase power | SaaS churn rates: 5-7% |
| Market Competition | High competition boosts power | Avg. price diff: 10-15% |
| Client Size | Large clients have more power | P&G ad spend: $7.8B (2023) |
Rivalry Among Competitors
Number and Diversity of Competitors
EDO competes in the advertising effectiveness measurement market, a space with many rivals providing campaign analytics. The diversity of these competitors, from established firms to startups, intensifies the competition. For example, the advertising analytics market was valued at $8.6 billion in 2024, with a projected CAGR of 12.8% from 2024 to 2032.
Industry Growth Rate
The advertising technology and analytics market is highly competitive. Slower growth, like the projected 11.5% in 2024, sharpens rivalry. Companies intensely pursue market share. This intensifies price wars and innovation pressures.
Brand Identity and Differentiation
EDO's real-time focus faces competition as rivals differentiate. Brand identity and unique offerings affect rivalry intensity. In 2024, the ad tech market saw $400B+ in global ad spend. Differentiation is key in this competitive landscape.
Exit Barriers
High exit barriers, such as specialized assets or long-term contracts, can trap companies in a competitive market, even when profits are low. This intensifies rivalry as firms fight for market share to cover fixed costs. For example, the airline industry, with its high capital investments in aircraft, often sees fierce competition. In 2024, the airline industry's net profit margin was approximately 3.4%, reflecting intense competition.
- High exit barriers increase rivalry.
- Specialized assets and long-term contracts are examples.
- Airlines are a good example of this.
- In 2024, airline profit margins were low.
Strategic Stakes
The strategic stakes in the advertising effectiveness market significantly impact competitive rivalry. Parent companies of EDO's rivals, like Kantar and Nielsen, may heavily invest in this area. These investments can lead to aggressive strategies, such as price wars or increased marketing efforts, to gain market share. This heightened competition directly affects EDO's market position and profitability.
- Kantar reported revenues of $2.9 billion in 2023, indicating substantial resources to invest in competitive strategies.
- Nielsen's revenue was approximately $6.5 billion in 2023, showcasing its ability to sustain competitive pressures.
- The advertising effectiveness market is projected to reach $28 billion by 2028, increasing the stakes for all players.
Ad Effectiveness Market: Billions at Stake!
Competitive rivalry in the ad effectiveness market is fierce, with many players and high stakes. High exit barriers intensify competition, keeping firms engaged even with low profits. EDO faces rivals backed by significant resources, leading to aggressive market strategies.
| Aspect | Details |
|---|---|
| Market Value (2024) | $8.6 billion |
| CAGR (2024-2032) | 12.8% |
| Ad Tech Market Spend (2024) | $400B+ |










